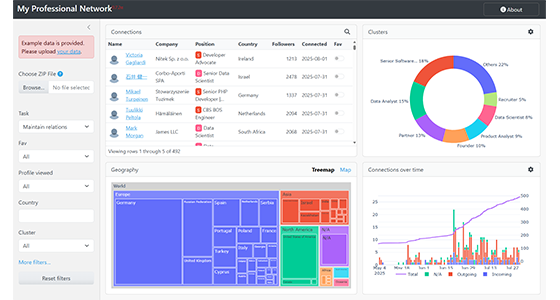
LinkedIn Analytics Web Application
A local-first web application that transforms LinkedIn Takeout exports into structured analytics on roles, industries, and geographic reach using NLP, unsupervised learning…
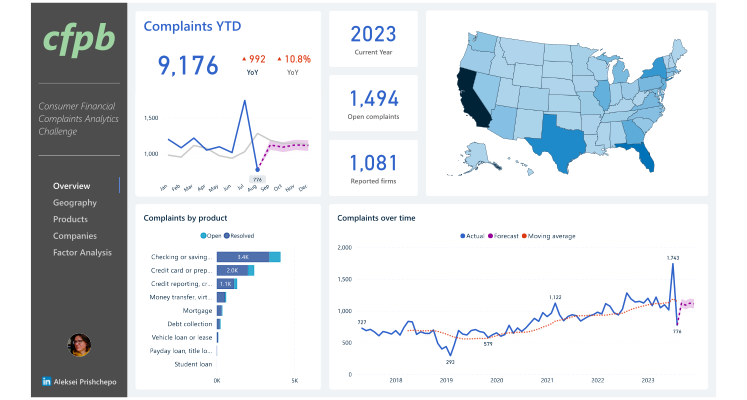
The dashboard integrates Power BI’s interactive reporting capabilities with R’s advanced analytics, enabling both descriptive and predictive analysis in a single, user-friendly interface. It was designed to help decision-makers monitor performance, segment customers, forecast revenue, and inform strategic decisions.
Implemented a forecasting model using R (auto.arima) to project future revenue based on historical trends and seasonality. Forecasts are embedded directly into Power Query.
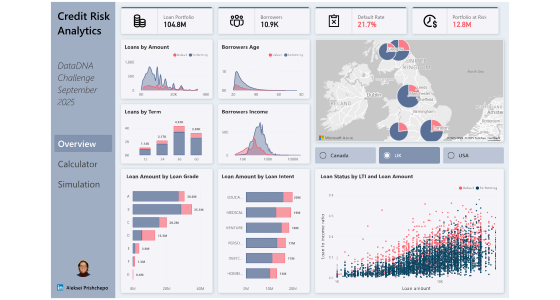
Combined traditional ABC revenue contribution analysis with XYZ demand variability to classify products by both importance and consistency. This dual segmentation empowers better inventory, pricing, and merchandising decisions.
Performed Recency-Frequency-Monetary (RFM) analysis to uncover customer value tiers (e.g., “Champions”, “Loyal”, “At-Risk”). This drives targeted retention and growth strategies by identifying high-value and at-risk customers.
Designed with accessibility and clarity in mind. The dashboard includes:
Summary KPIs and trends.
Loyalty and customer behavior insights.
Product performance breakdowns.
Pricing and discount impact visualizations.
All visuals support interactive filtering and drill-downs to support ad hoc analysis.


See details of implementation in the blog post: Building an E-Commerce Dashboard with Power BI and R
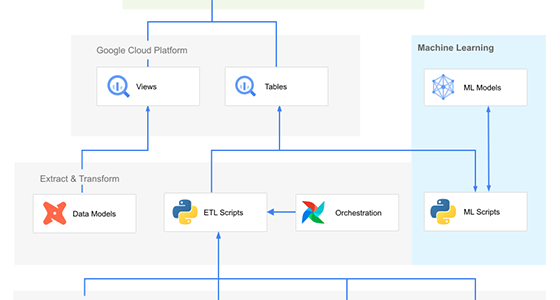
Cleaned and shaped data; structured the model with a “star schema” to optimize performance.
Leveraged Deneb with Vega-Lite to create advanced visualizations beyond the standard Power BI library.
Integrated R directly into Power BI workflows for forecasting and segmentation logic.
The dashboard allows users to explore revenue trends, understand customer segments, and assess portfolio performance.
Forecasting equips business leaders with forward-looking insights that support planning and target-setting.
Selected as winner in both overall and accessibility categories in the November 2025 DataDNA Dataset Challenge.
Power BI report development • R analytics & forecasting • Data modeling & ETL • Advanced segmentation • Interactive visualization • BI storytelling
If your organization could benefit from enhanced e-commerce analytics, you’re welcome to reach out via contact page to discuss how I can help leverage data science, analytics, and automation to drive value for your business.