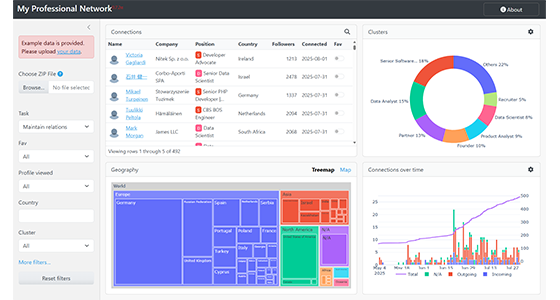
LinkedIn Analytics Web Application
A local-first web application that transforms LinkedIn Takeout exports into structured analytics on roles, industries, and geographic reach using NLP, unsupervised learning…
This project involved designing and operating a company-wide BI system that unified data from multiple operational and analytical sources into a single, reliable analytics platform. The objective was to eliminate fragmented reporting, reduce manual data retrieval, and provide decision-makers and employees with timely, consistent performance insights.
The system serves as the analytical backbone of the organization, supporting day-to-day operational decisions as well as strategic planning.
Consolidates data from ERP systems, e-commerce platform, Google Analytics, PBX, Help Desk, and task trackers into a single analytical model.
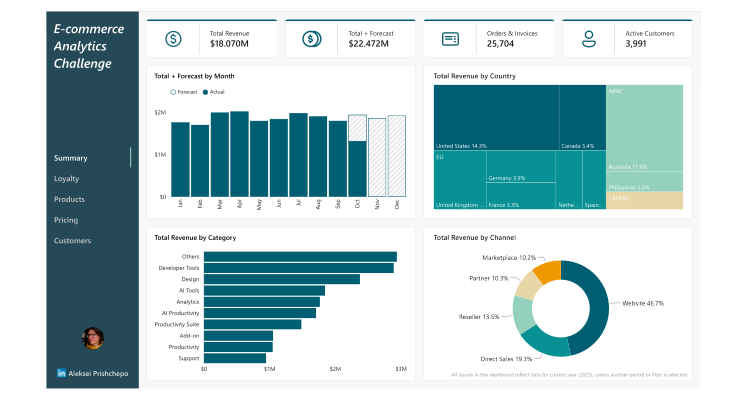
Delivers structured insights across four core business areas: Finance, Supply, Marketing, and Sales, each with domain-specific KPIs and metrics.
Dashboards and reports are refreshed every two hours during business hours, enabling timely operational and tactical decisions.
Provides employees with visibility into their own performance and quality metrics, linking daily actions to measurable outcomes.
Designed to support growth in data volume, business complexity, and analytical use cases without re-architecting the system.
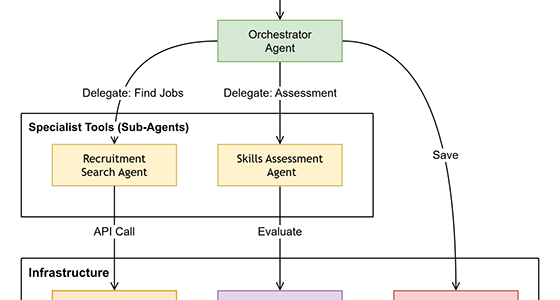
Below is a flowchart illustrating the main components of the BI system and their interactions.
See the article for an overview of the system components and data flows.

Built and maintained production ETL pipelines using Apache Airflow, dbt, and BigQuery (13 DAGs, 70+ tasks, 100+ tables, 50+ views), ensuring reliability and data quality.
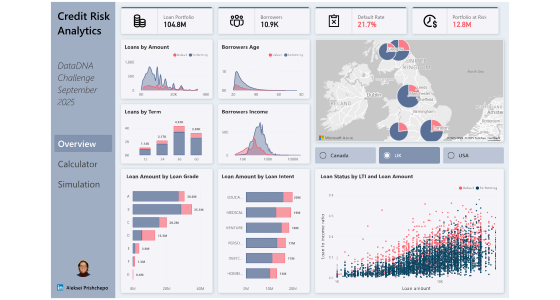
Designed analytical data models optimized for KPI reporting, cohort analysis, customer segmentation, and cross-functional analytics.
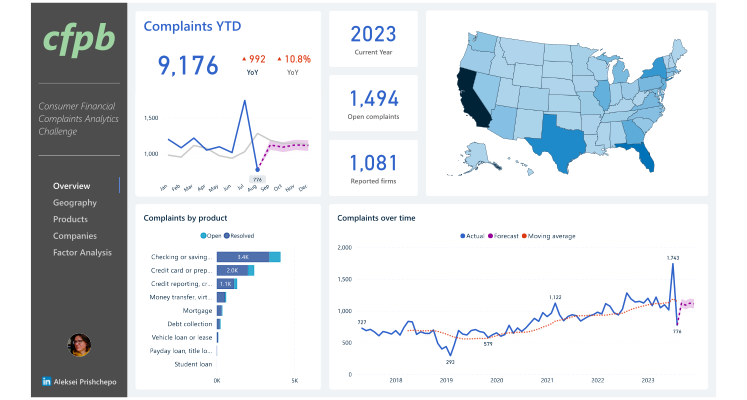
Developed and maintained Power BI dashboards spanning finance, supply chain, and marketing (5 datasets, 7 reports, 50+ pages), tailored to different stakeholder needs.
Integrated both transactional and behavioral data sources, enabling a holistic view of business performance.
Significant reduction in manual reporting effort, especially in supply and marketing teams, freeing time for higher-value analytical work.
Improved decision speed and consistency through a single source of truth for business metrics.
Higher employee engagement and accountability by exposing real-time performance and quality indicators.
Operational scalability, allowing analytics to grow alongside the business without increasing reporting overhead.
Business Intelligence architecture • Data engineering • ETL orchestration • KPI design • Power BI dashboarding • SQL & Python • Data modeling • Operational analytics • Cross-functional stakeholder support
If you have a business problem that requires data-driven solutions, feel free to reach me via the contact page to discuss how I can help leverage data science, analytics, and automation to drive value for your company.