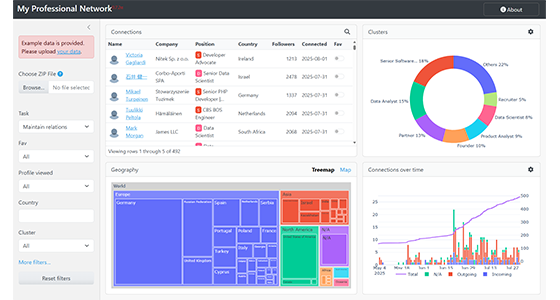
LinkedIn Analytics Web Application
A local-first web application that transforms LinkedIn Takeout exports into structured analytics on roles, industries, and geographic reach using NLP, unsupervised learning…
This project demonstrates how advanced credit risk analytics can be embedded directly into an interactive BI dashboard. Rather than focusing on static reporting, the dashboard is built around two decision-oriented components: a credit risk calculator and a portfolio simulation engine.
Usually limited to notebooks or backend systems, these can be transformed into interactive, business-oriented tools.
An interactive calculator that estimates a borrower’s probability of default based on input characteristics. Uses marginal effects derived from a GLM model to quantify how changes in borrower attributes affect default risk.
Explicitly exposes how borrower features contribute to risk, bridging the gap between statistical modeling and business understanding.
Allows users to assess “what-if” scenarios, such as tightening credit criteria or shifting portfolio composition toward lower- or higher-risk segments.
A simulation framework that generates synthetic credit portfolios by varying the proportions of borrowers with specific risk characteristics. Enables exploration of infinitely many portfolio compositions to evaluate expected defaults, losses, and financial outcomes under different risk mixes.
Connects borrower-level risk estimation with portfolio-level financial impact, illustrating how micro-level decisions scale into macro risk exposure.


Cleaned and structured credit data using Power Query to ensure consistency of borrower attributes, outcomes, and modeling inputs.
Built a GLM-based credit risk model in R and calculated marginal effects to support interpretable, borrower-level default probability estimation.
Developed R scripts to create synthetic portfolios by sampling the original dataset with some added noise to numeric features, then used the pre-trained on the original data XGBoost model to predict default probabilities for the synthetic borrowers.
Executed R scripts within the BI workflow to power the risk calculator and simulation logic.
Exposed model outputs and simulations as interactive Power BI elements, enabling real-time experimentation without requiring statistical tooling.
See details of implementation in the blog post: Building a Credit Risk Dashboard with Power BI and R
Demonstrates non-trivial analytics inside BI: shows that dashboards can support modeling, simulation, and decision logic.
Supports credit policy thinking: enables exploration of how borrower-level rules translate into portfolio-level risk and financial outcomes.
Improves model interpretability: uses marginal effects to make statistical risk models understandable to non-technical stakeholders.
Reusable analytical pattern: the approach can be extended to PD/LGD modeling, stress testing, or regulatory scenario analysis.
Credit risk modeling • GLM & marginal effects • Portfolio simulation • Synthetic data generation • Power BI as decision-support tooling • R analytics • Risk interpretability • Financial modeling mindset
Interested in building interactive analytics tools? Let’s discuss your data, constraints, and goals.