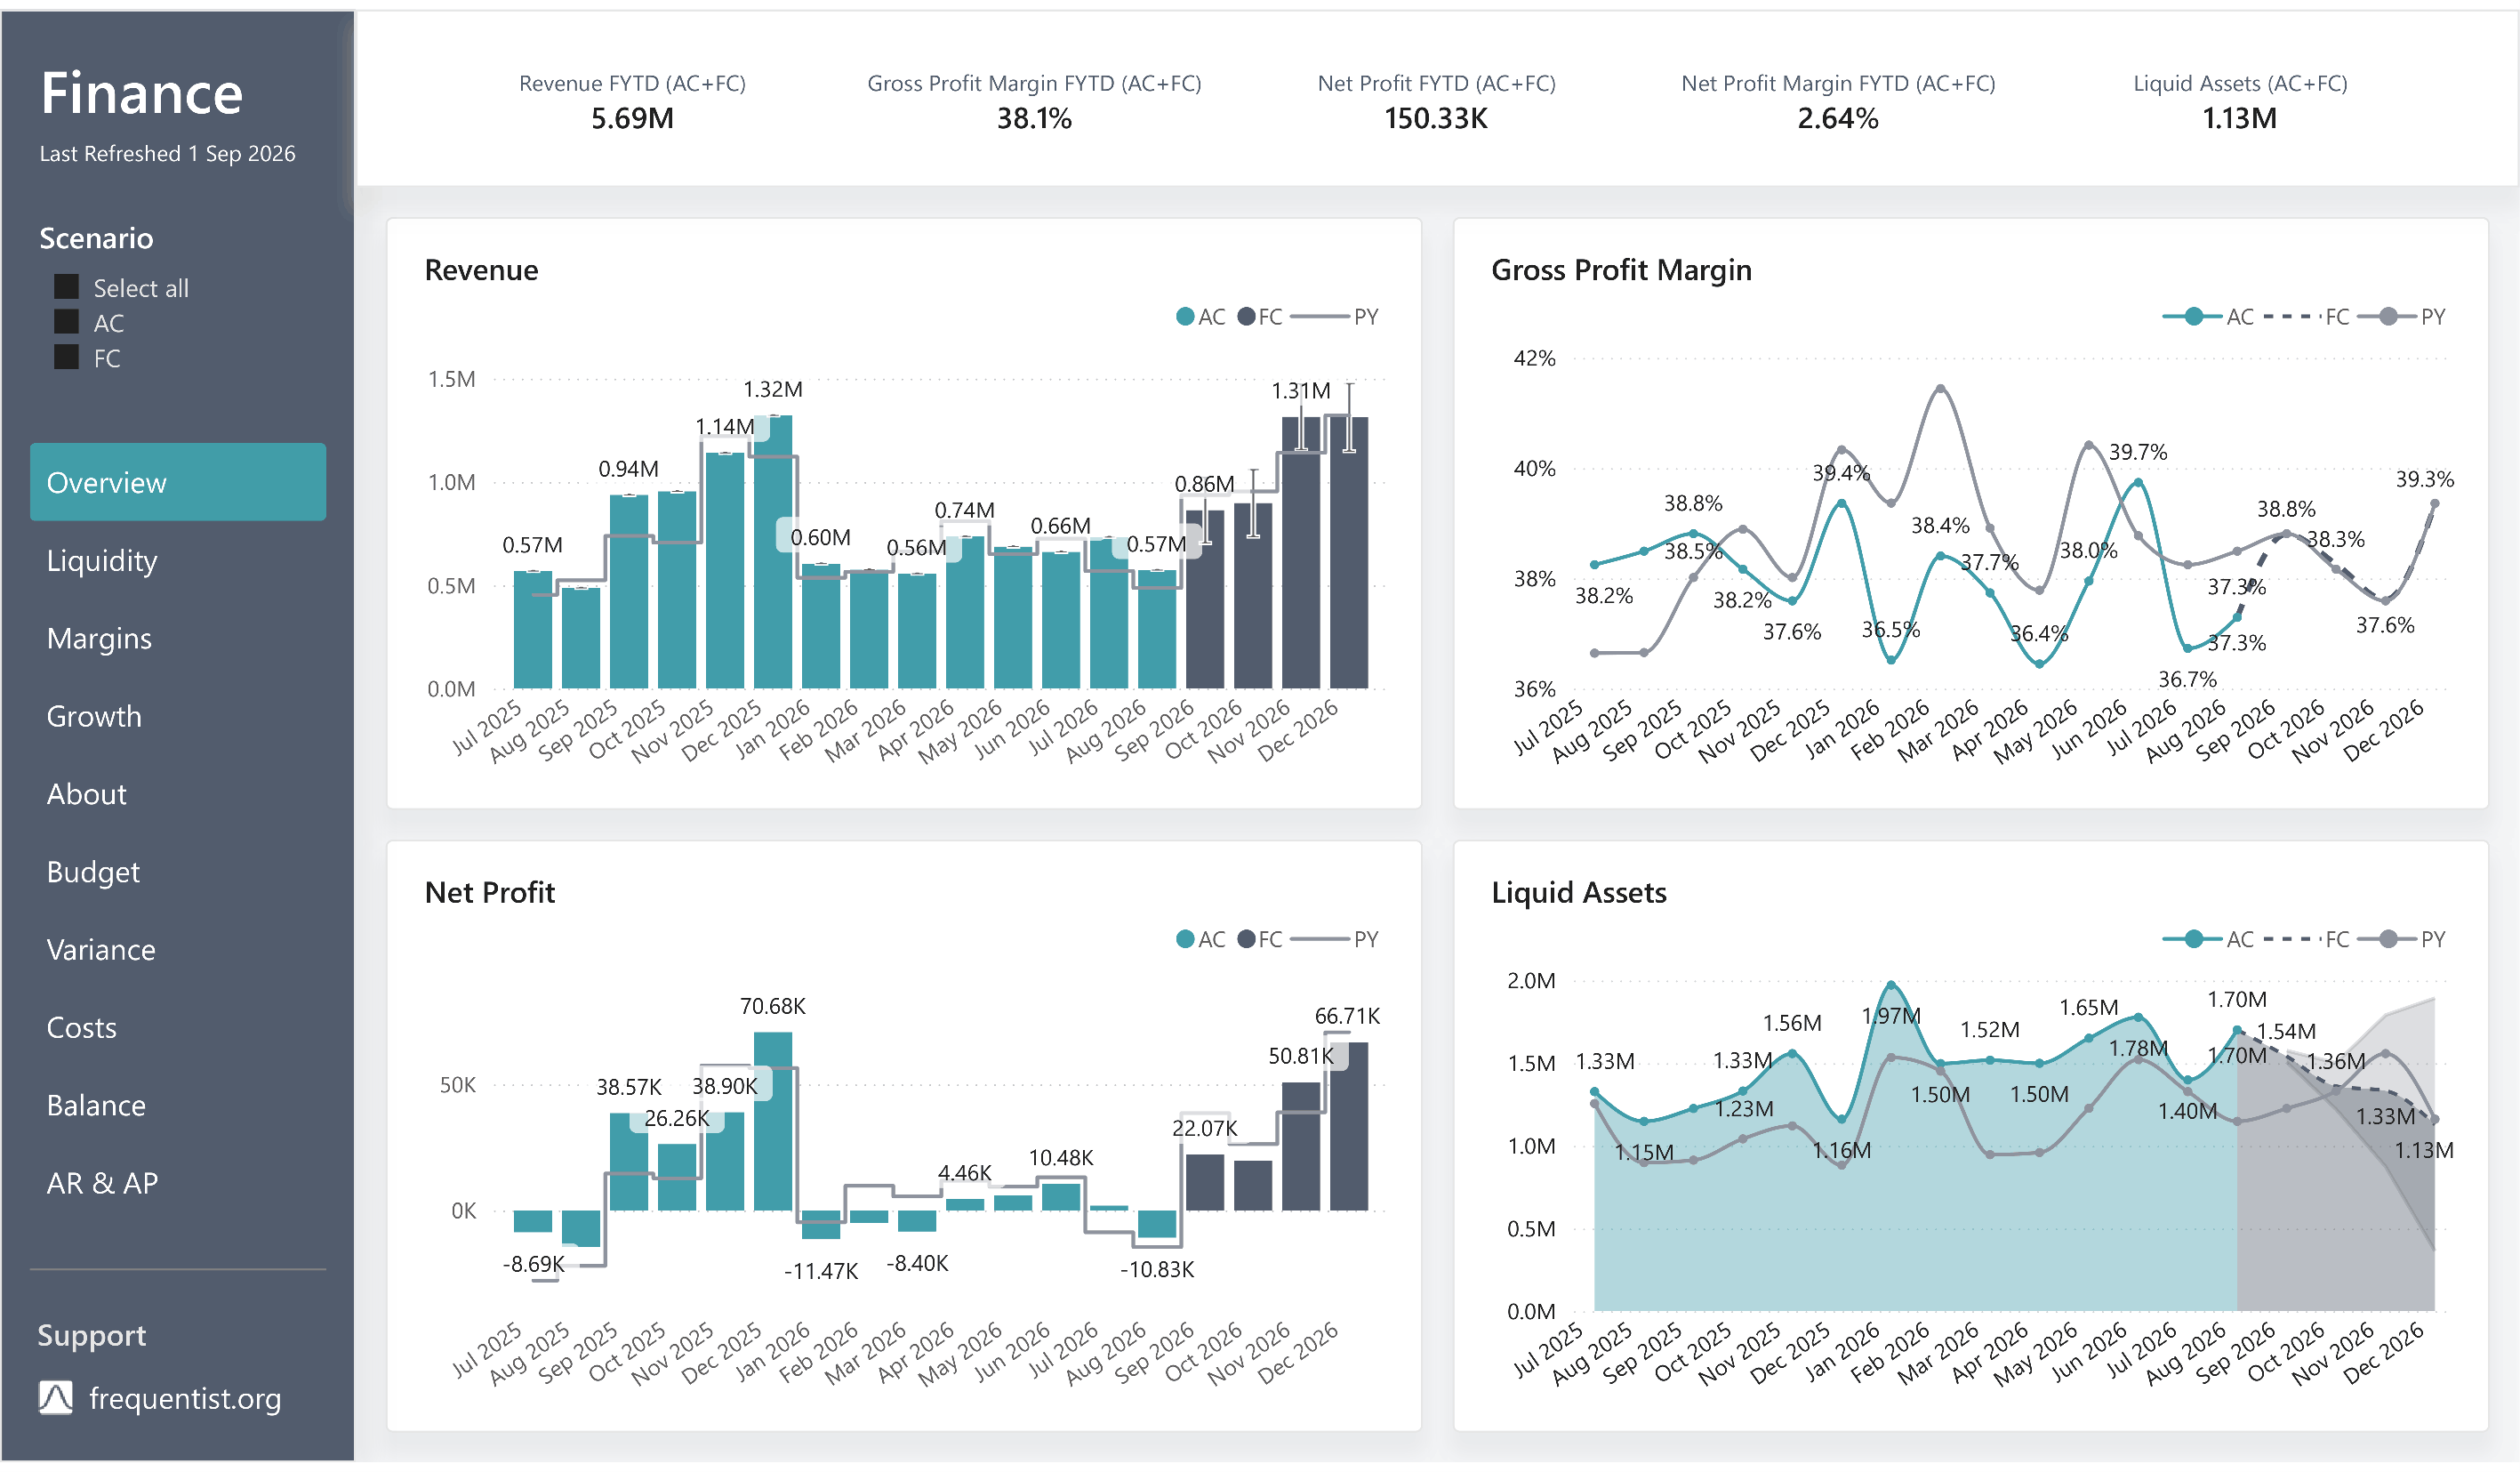
Business Central Finance Dashboard with Forecasts (Fabric + R + Power BI)
Financial reporting and forecasting with Power BI, Microsoft Fabric and R. Combines actuals, budget and revenue forecasts to project profitability and cash flow, with…
Many companies have data but no reliable picture of what it means. Reports are assembled manually in Excel, metrics are not defined consistently, and decisions rest on outdated snapshots instead of current facts.
I build business dashboards and BI reporting solutions that solve this problem structurally — SQL-based, reproducible, and aimed directly at operational decisions. See reference projects ↴
A business dashboard is not an end in itself. It is a decision tool: a continuously updated view of the metrics that actually matter to your business.
A dashboard pays off when:
Which decisions should the dashboard support? Who uses it, how often, and with what prior knowledge? These questions determine the structure and level of detail — before a single line of SQL is written.
I analyze your existing data sources (database, CRM, ERP, flat files), identify inconsistencies and build a clean, reproducible data model. No dashboards on shaky foundations.
Implementation in Power BI, complemented by R or Python for complex calculations, statistical models or forecasts. The focus is on clarity: the right visualization for the right purpose — no charts for the sake of charts.
You receive not just the finished dashboard, but also documentation of the logic, the data sources and the metric definitions — so your team can understand it and develop it further on their own.
I work primarily with Power BI for dashboards and interactive reporting. For data preparation and complex analysis I add SQL, R and Python. Data pipelines are built with standardized ETL/ELT workflows that integrate into existing infrastructure.
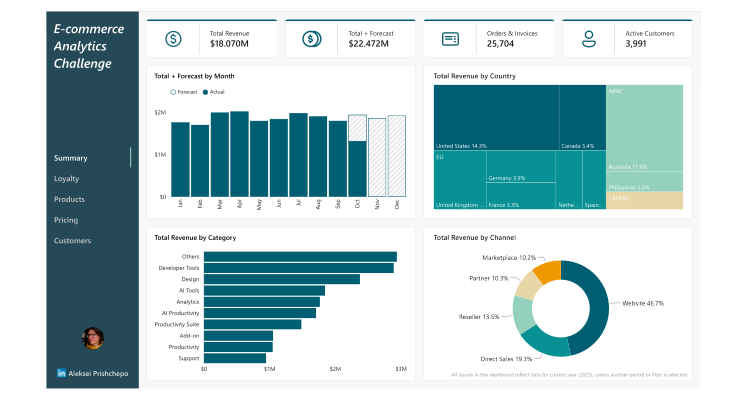
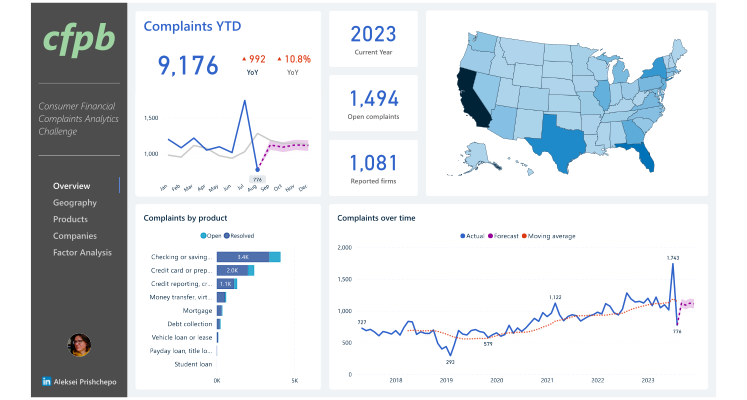
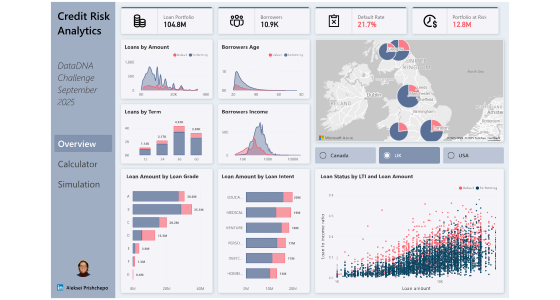
Examples of my dashboard work:
My clients are typically mid-sized companies, startups and agencies in Berlin and the EU that want to professionalize their BI reporting or build it in a structured way for the first time. I work project-based or hourly — remote or on-site in Berlin.
I am not a generalist provider. I take on projects that call for analytical substance — not just visually appealing charts.
Do you have a specific dashboard project, or do you want to fundamentally improve your existing reporting?
Hourly rate for ad hoc requests: €90/h. All prices plus VAT.