Sales Signals app (Agentic AI)
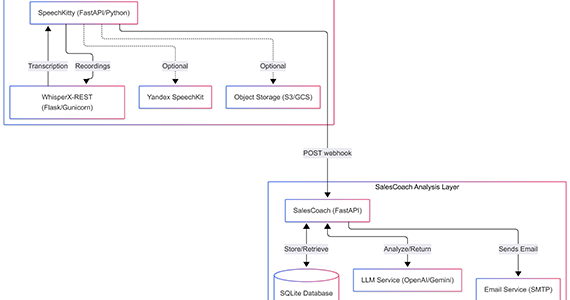
Automated sales coaching engine that turns B2B call transcripts into real-time, context-aware feedback, combining LLMs and historical customer data to surface revenue and…
Financial reporting explains what has happened. This solution adds a forward-looking view, combining actuals, budget and forecasts to help finance teams understand where the business is heading. It brings revenue forecasting, cash-flow projections and financial performance analysis into one Power BI report, with uncertainty ranges and historical backtesting to show how reliable the forecasts have been.
The solution runs on Microsoft Fabric, with a Lakehouse and SQL views connecting financial data to Power BI. R scripts generate and backtest forecasts, while a redesigned report combines historical performance, budget and projections in a consistent analytical model. The underlying measures support both historical and future periods, including profitability, liquidity and other financial KPIs.
The data model follows Business Central’s chart of accounts and table structures, making the solution applicable to companies using Business Central as their financial system.
To see the solution in action, check out the demo.
| Capability | Implementation |
|---|---|
| Financial reporting | Ten pages organised around finance questions |
| Planning horizon | Actuals, budget and forecasts in a consistent analytical model |
| Revenue forecasting | Weekly projections selected through multi-horizon backtesting |
| Cash-flow planning | Daily cash projections based on expected receipts and budgeted payments |
| Financial outlook | Forecast revenue combined with budgeted costs to project profit and other KPIs |
| Forecast uncertainty | 80% and 95% prediction ranges with historical coverage statistics |
| Data architecture | Microsoft Fabric Lakehouse, SQL views, R forecasting scripts and Power BI |
Forecast and budget rows are added to the general ledger in SQL views, next to the actual entries. The report’s measures for balances, ratios and margins work on future dates without being rewritten. A scenario slicer switches between actuals (AC), forecast (FC) or both, and titles say which one is shown.
Weekly, through the end of the next quarter. Nine methods, from seasonal benchmarks to regression and ARIMA, are tested against the past 12 months. The winner has the lowest combined error over one week, four weeks, eight weeks and the full horizon, since the reader’s planning horizon is not known in advance. Every forecast comes with 80% and 95% ranges.
Open invoices and forecast sales become expected receipts, timed by how customers actually paid over the past 12 months. Outgoing payments follow the budget, on the days of the month each kind of payment usually leaves the bank: salaries at the end of the month, rent at the start, suppliers on their payment terms, tax prepayments on their due dates. The result is a day-by-day cash balance with a low case. The Liquidity page shows the date on which the low case first drops below a threshold the reader sets.
For the remaining months, forecast revenue is combined with budgeted expenses to project profit, margins, cash flow and related financial KPIs. Cost of goods sold follows the budgeted margin, variable and fixed expenses follow their respective budget assumptions, and income tax is calculated from projected profit. This provides a forward-looking financial outlook that combines expected revenue with planned expenditure.
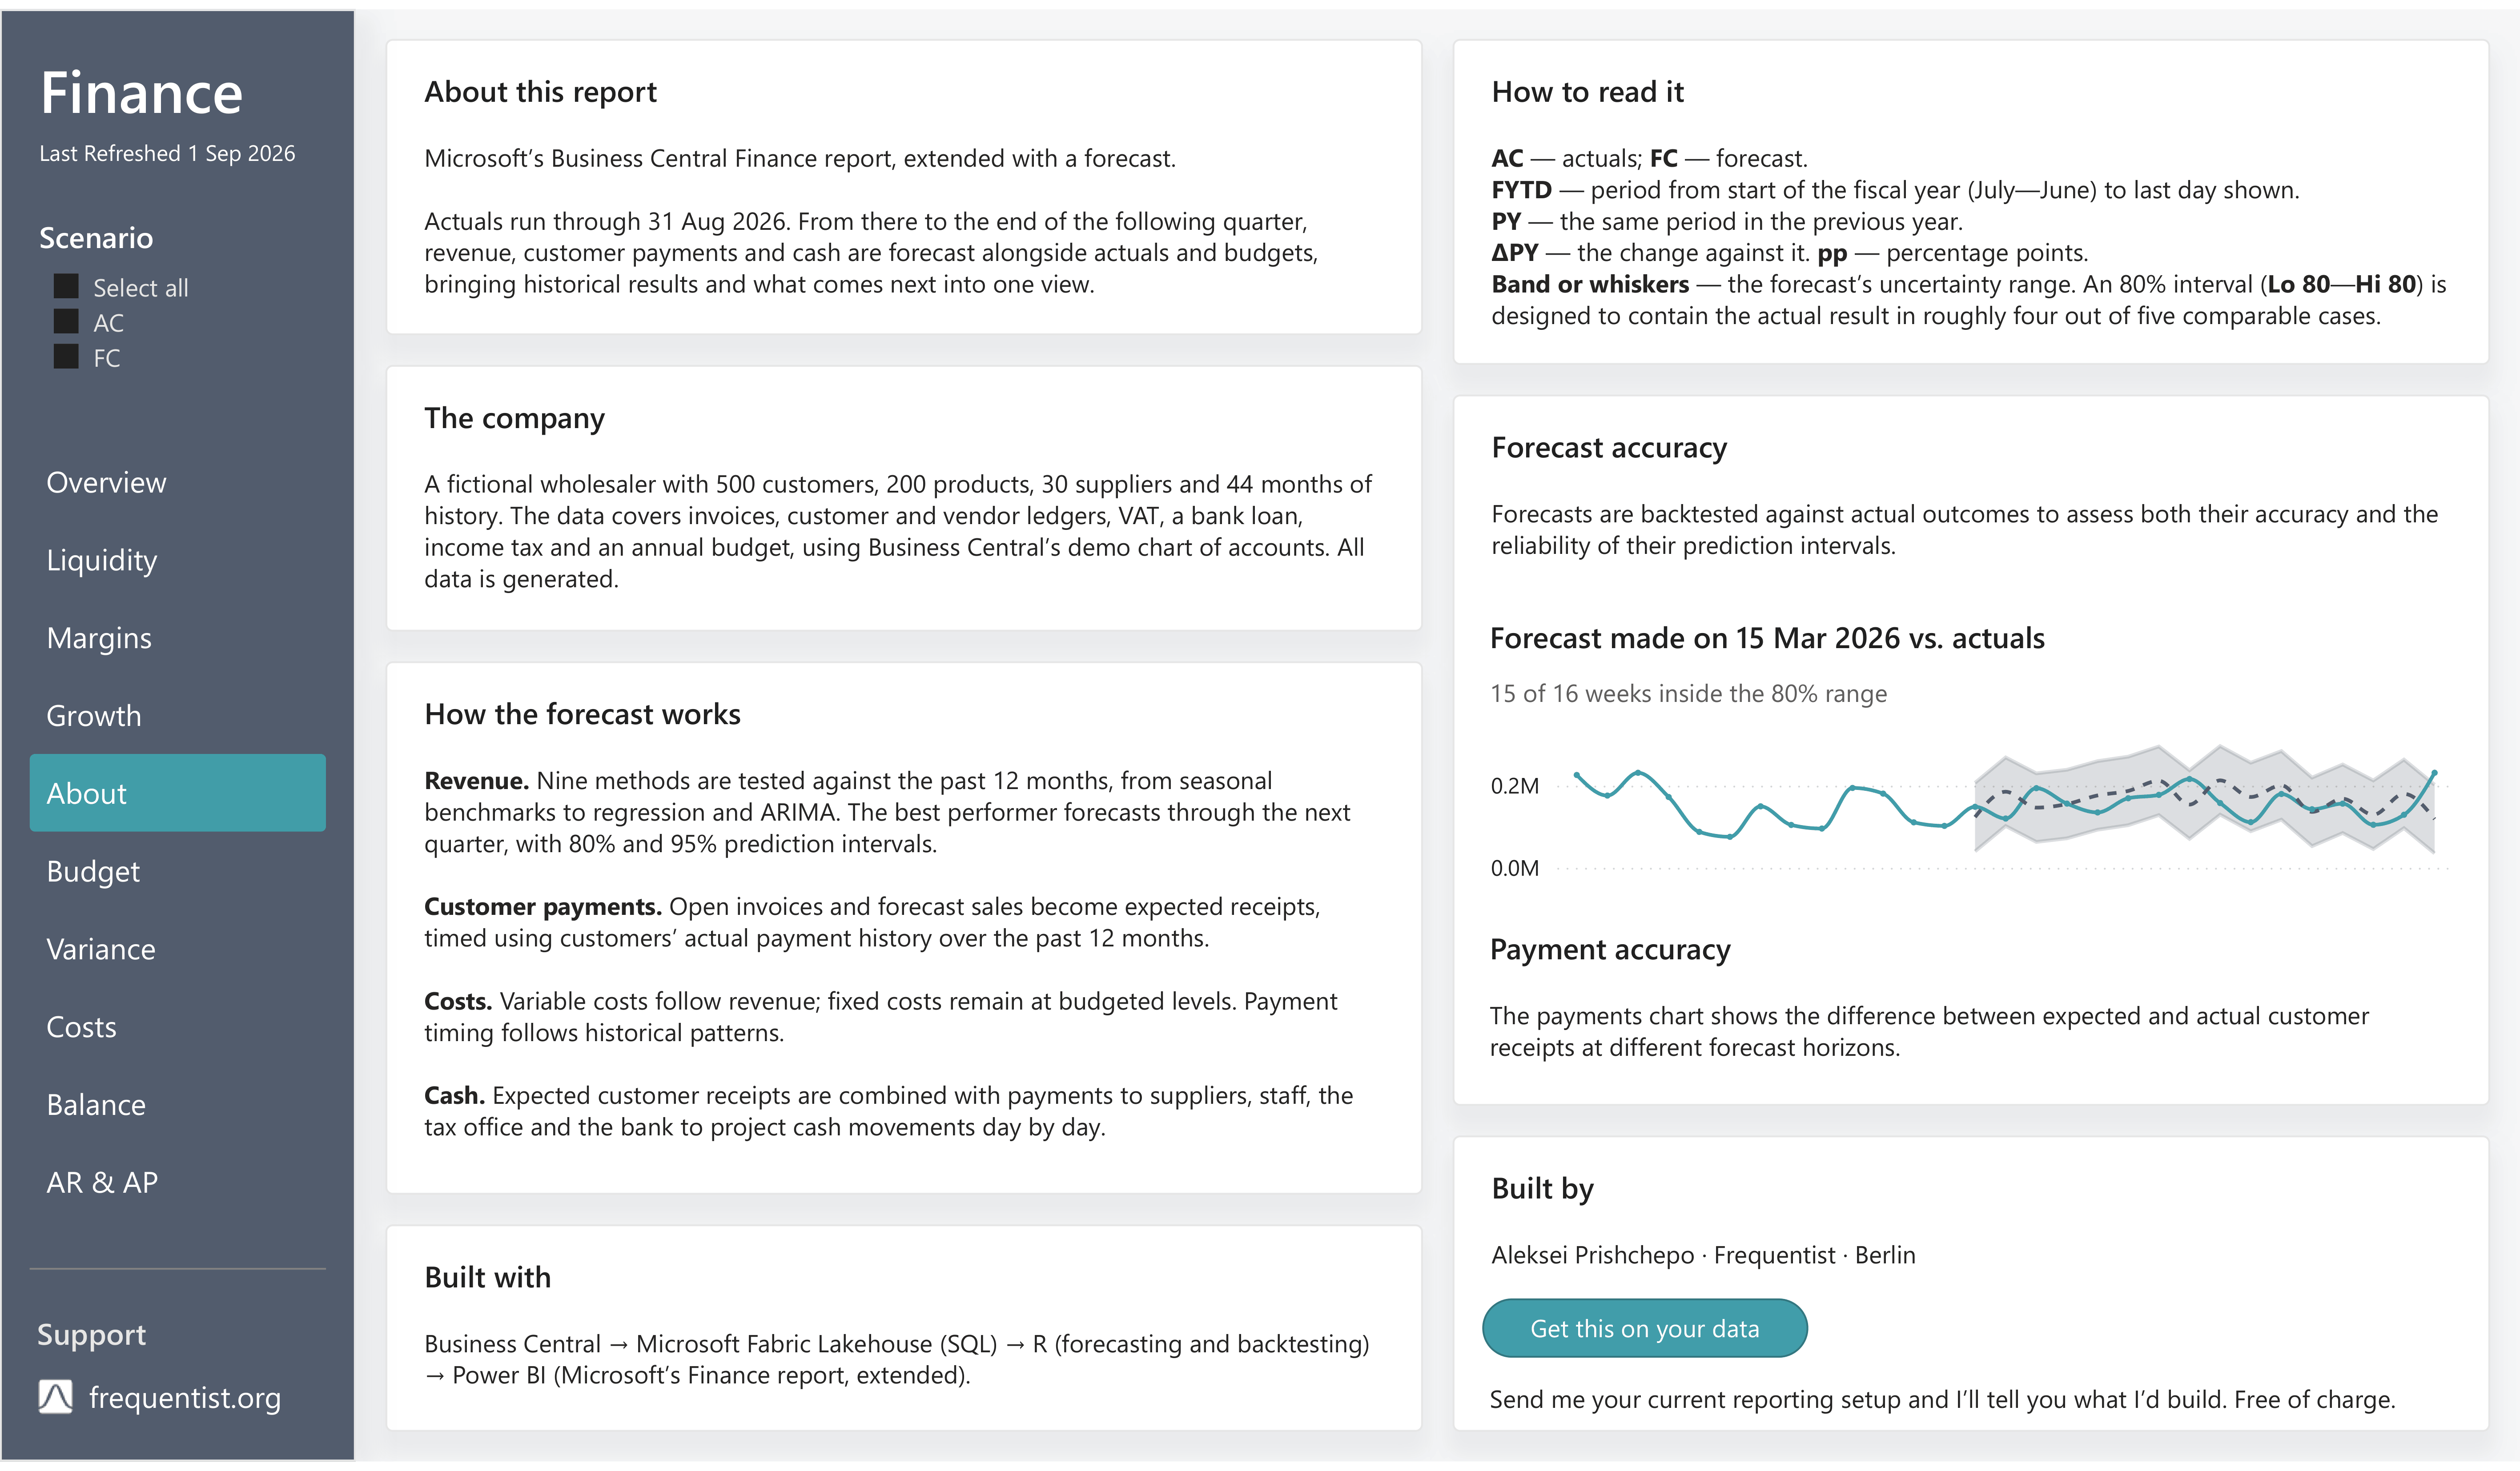
Weekly ranges are combined over the weeks a figure covers, which backtests showed to hold for balances up to about a quarter ahead. The About page puts a past forecast next to what was booked afterwards: 15 of its 16 weeks landed inside the 80% range.
Ten pages, each answering one question. Five are published here: an overview of revenue, margins, profit and liquid assets against last year; liquidity ratios with the cash outlook and its low case; margins with a DuPont analysis and a net profit bridge; growth against last year with a breakdown of what moved the assets; and a page on how the forecast works and how well it has done. The other five (budget, variance, costs, balance sheet, receivables and payables) are available on request.
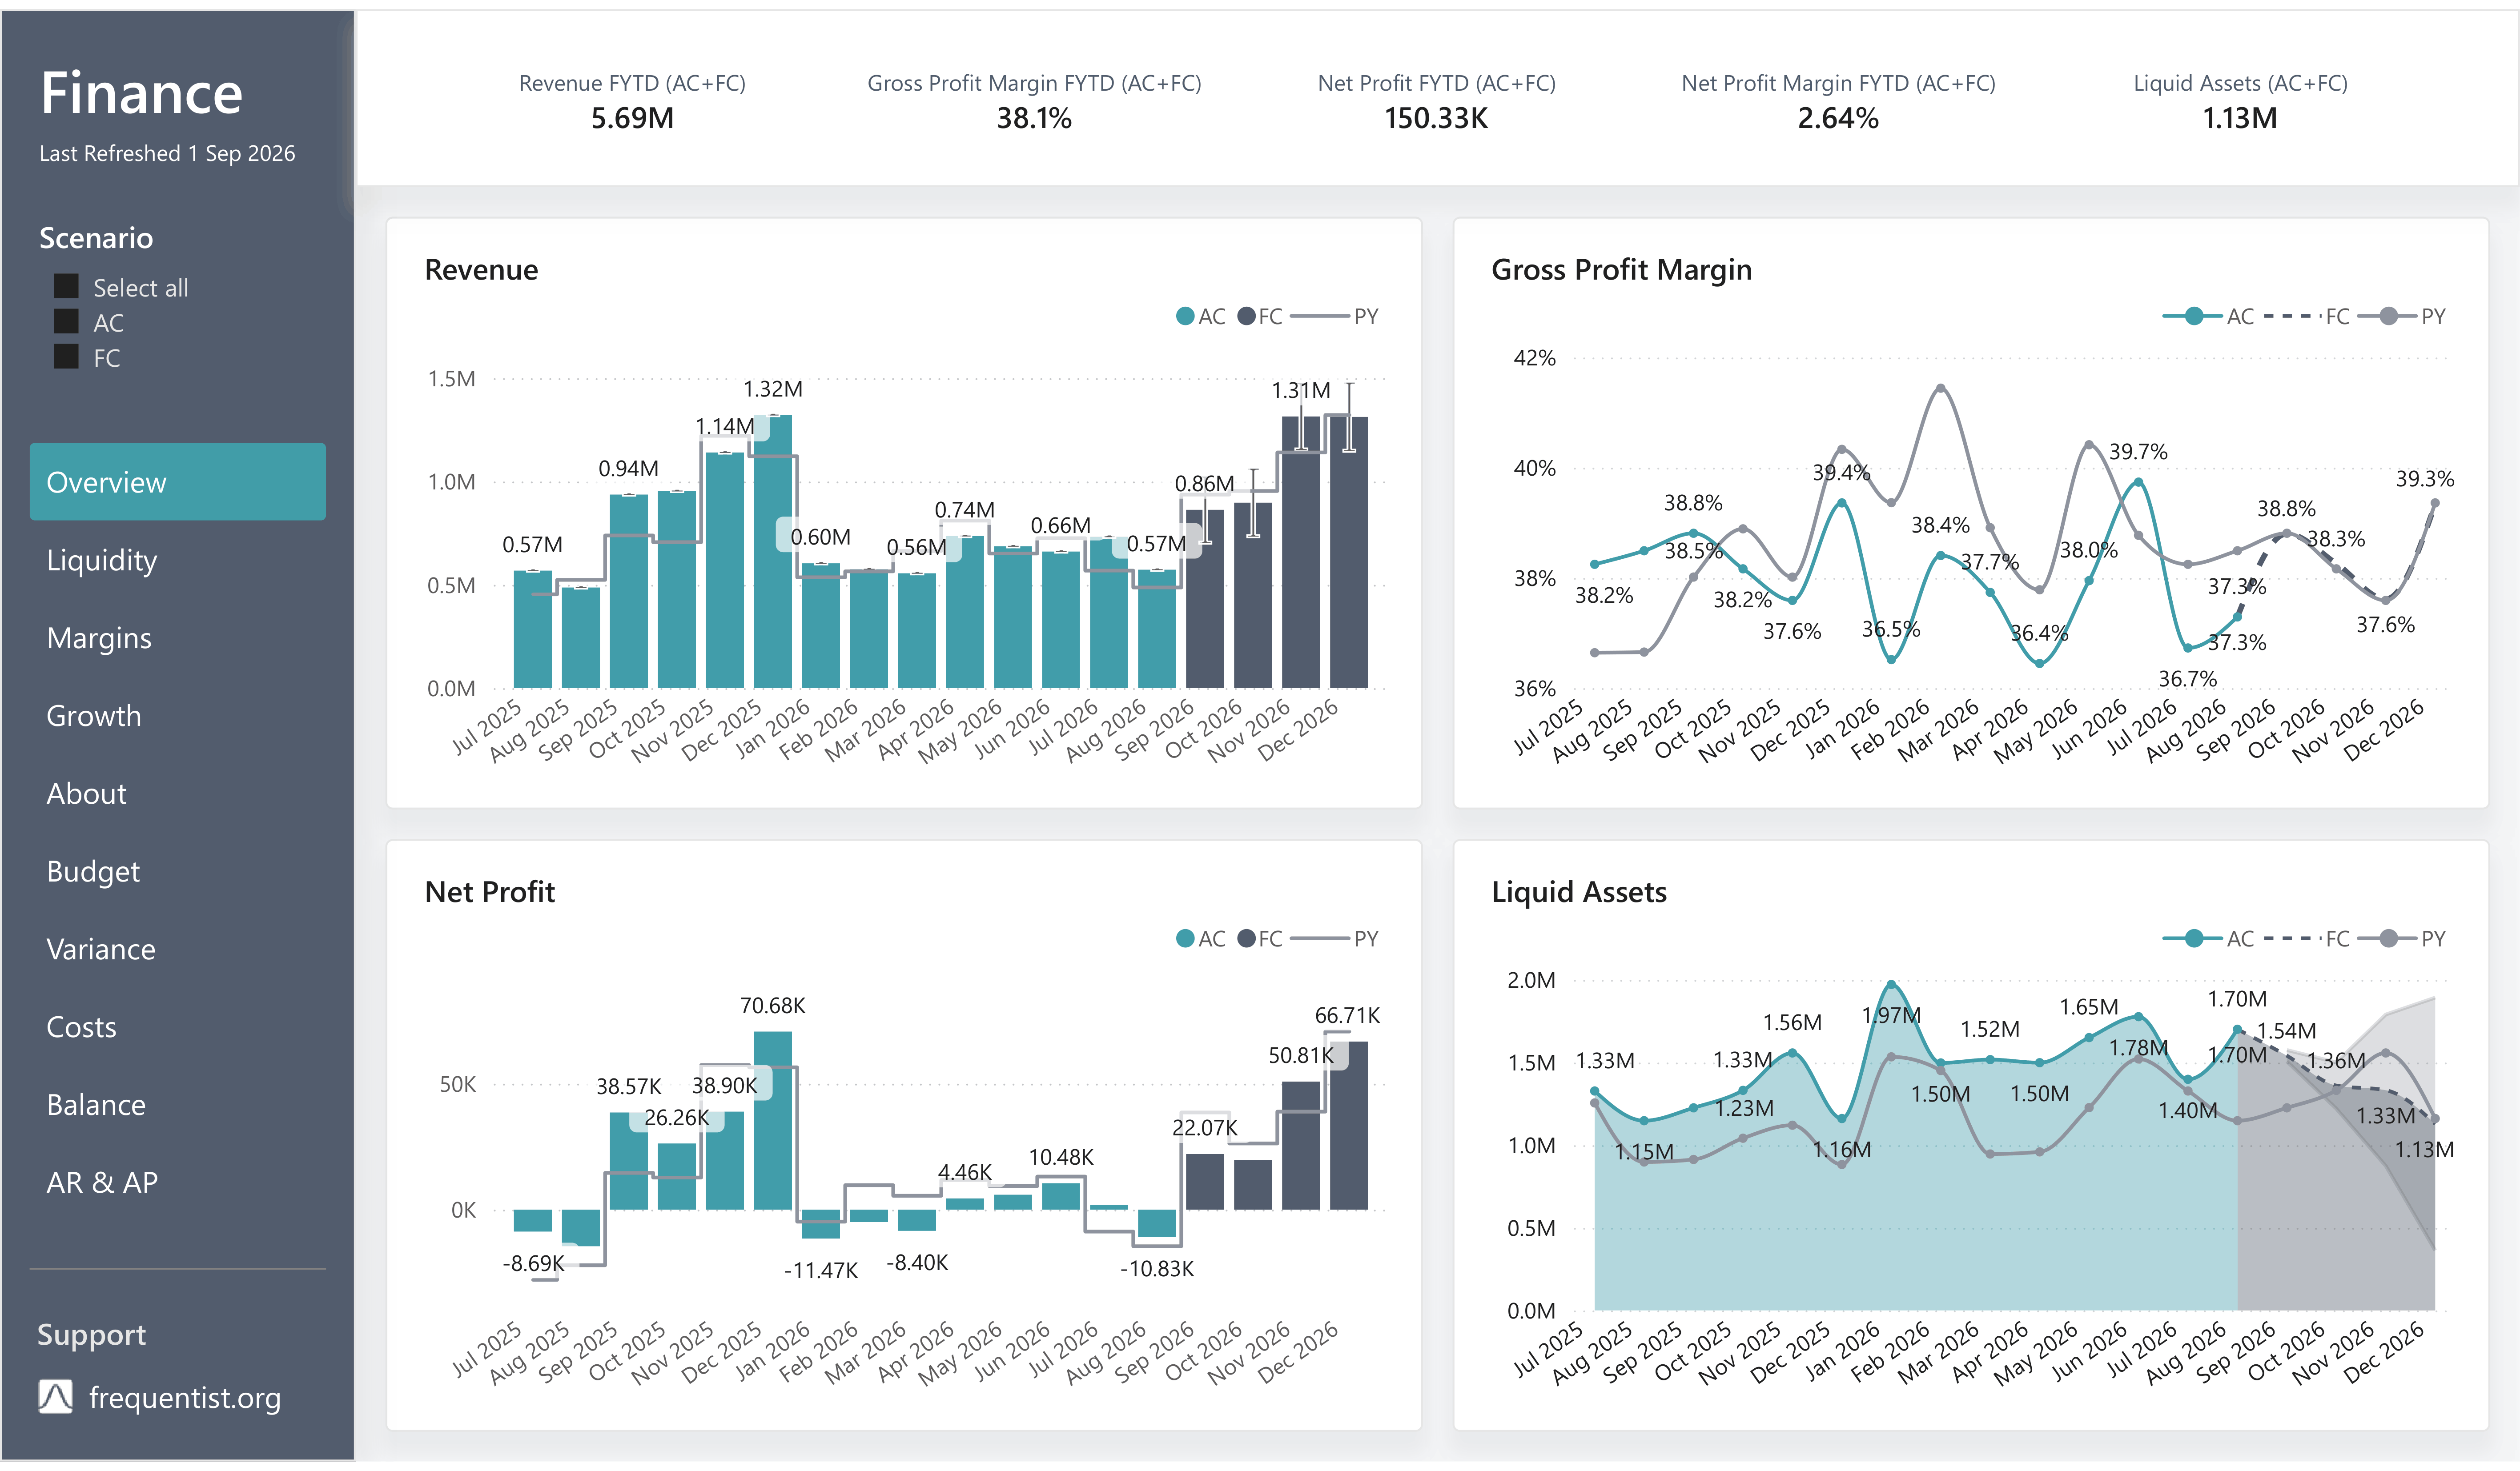
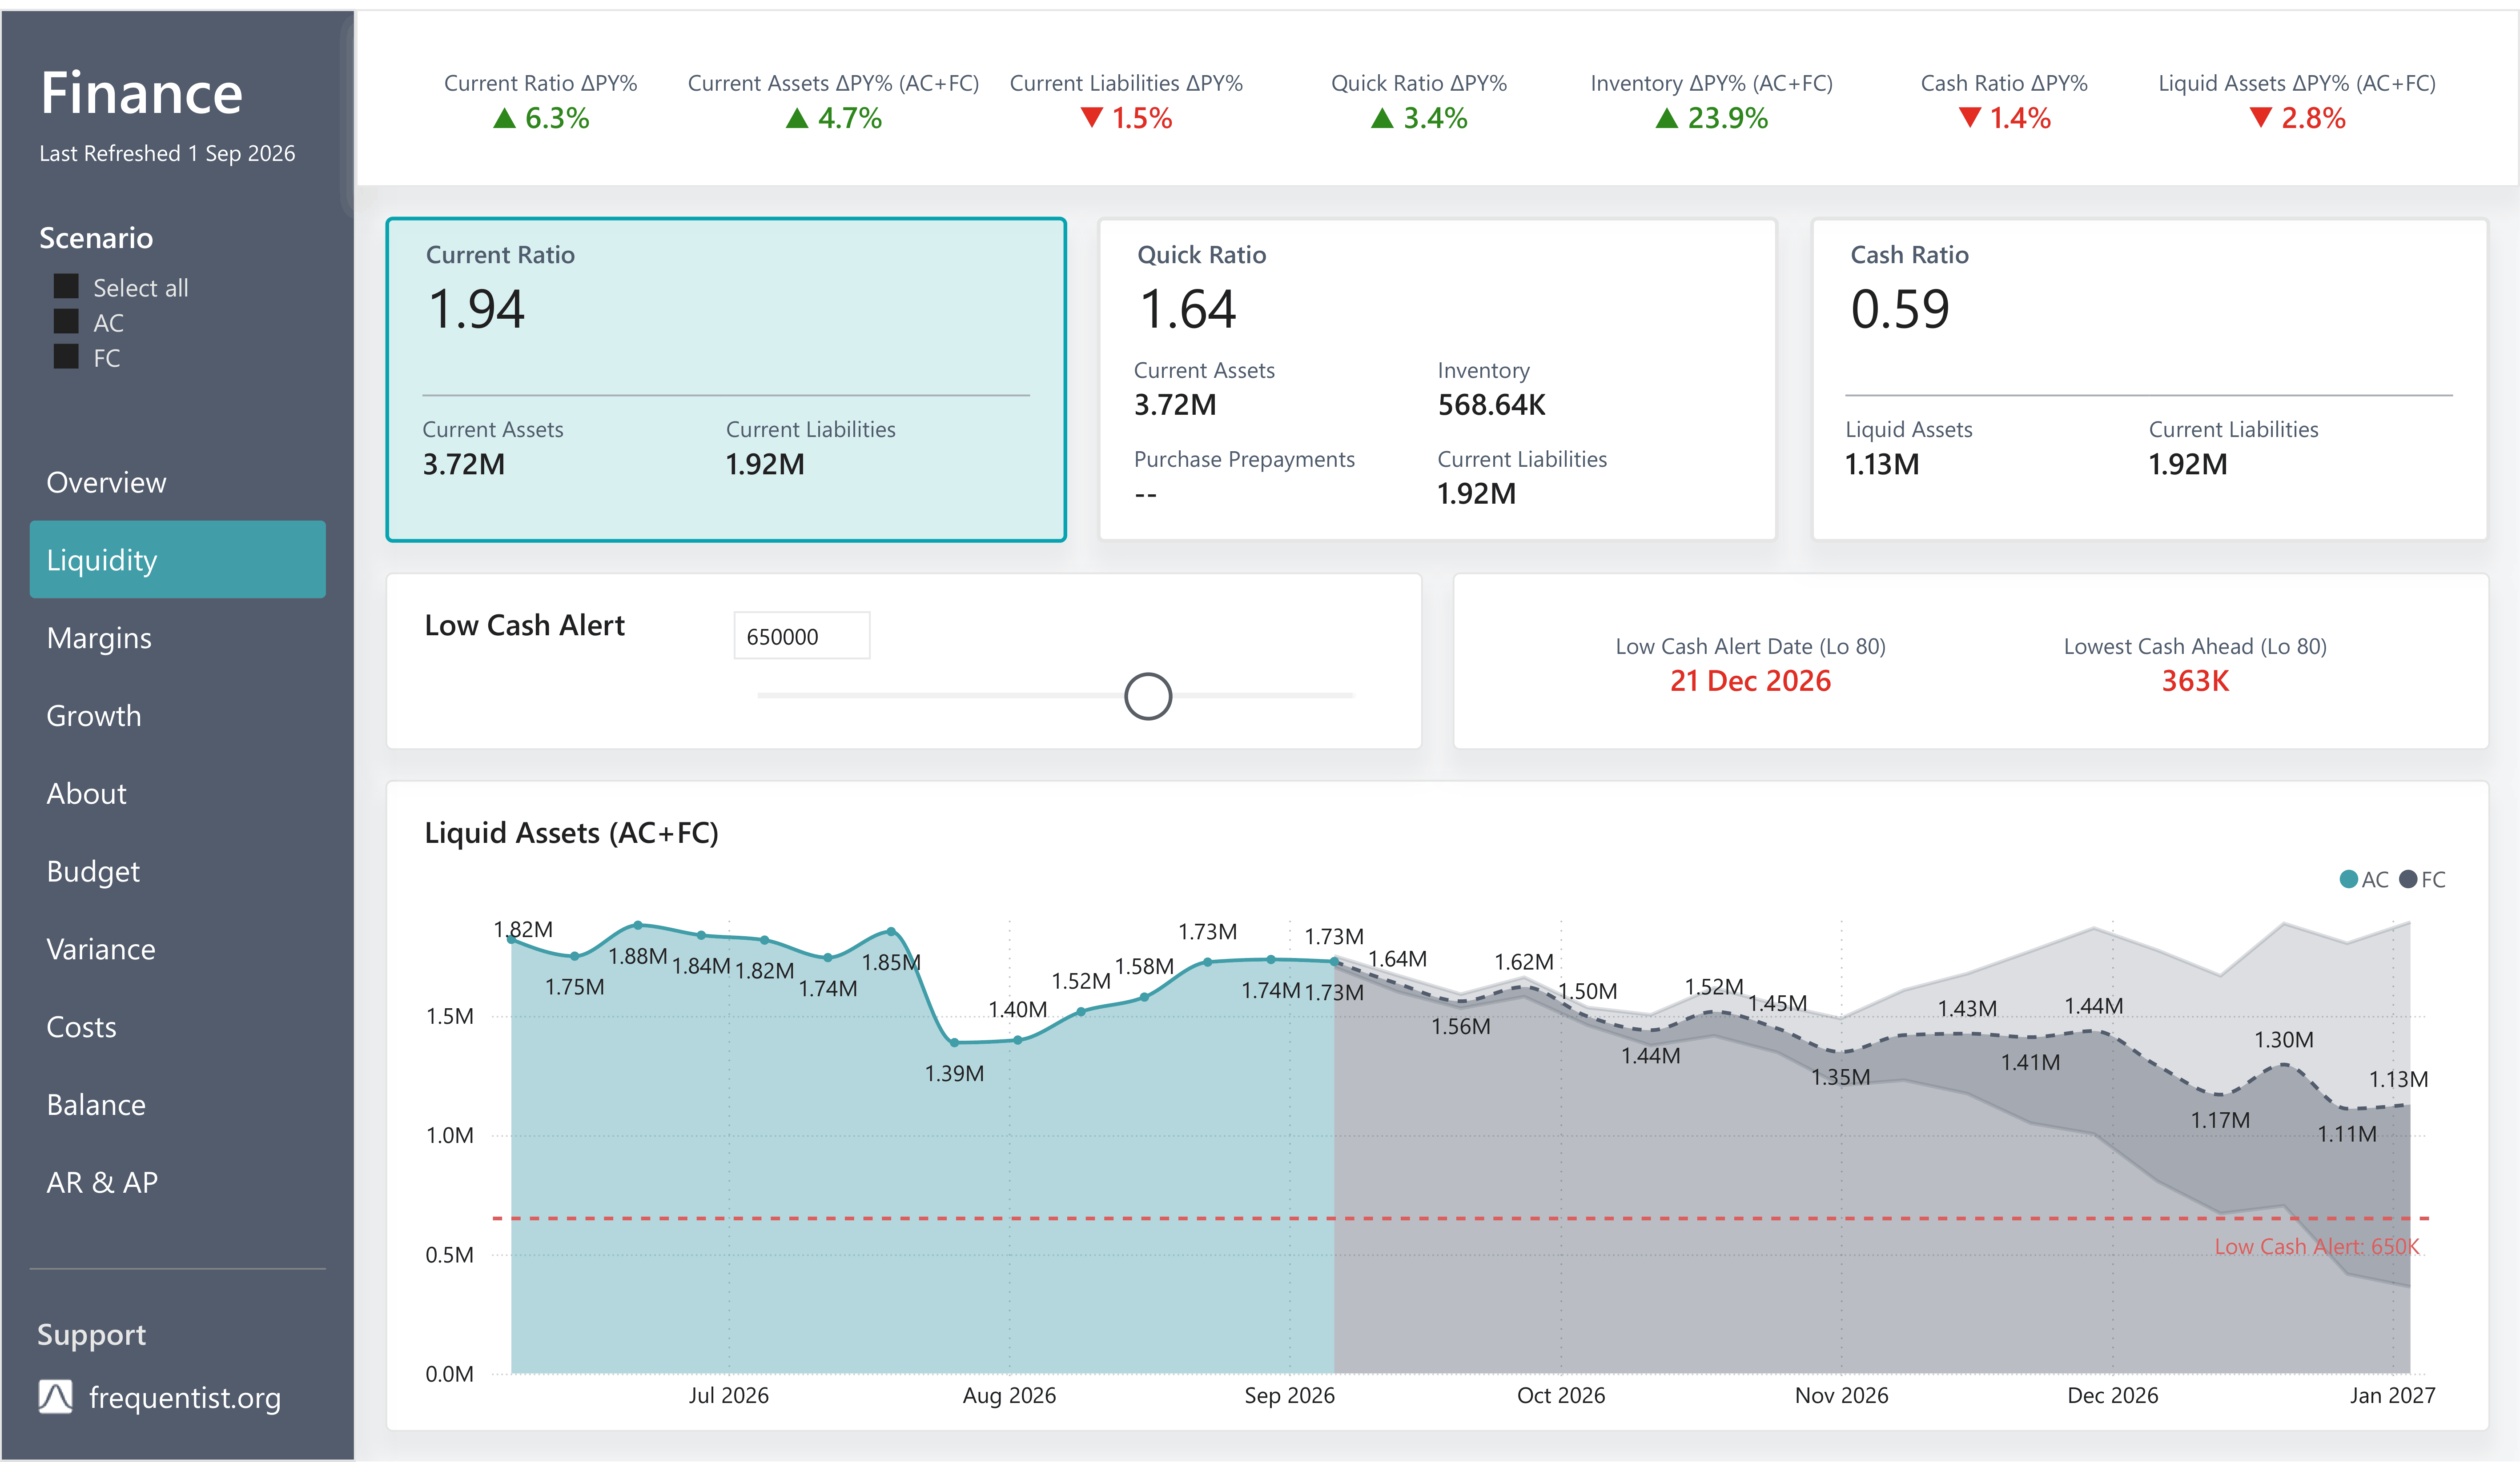
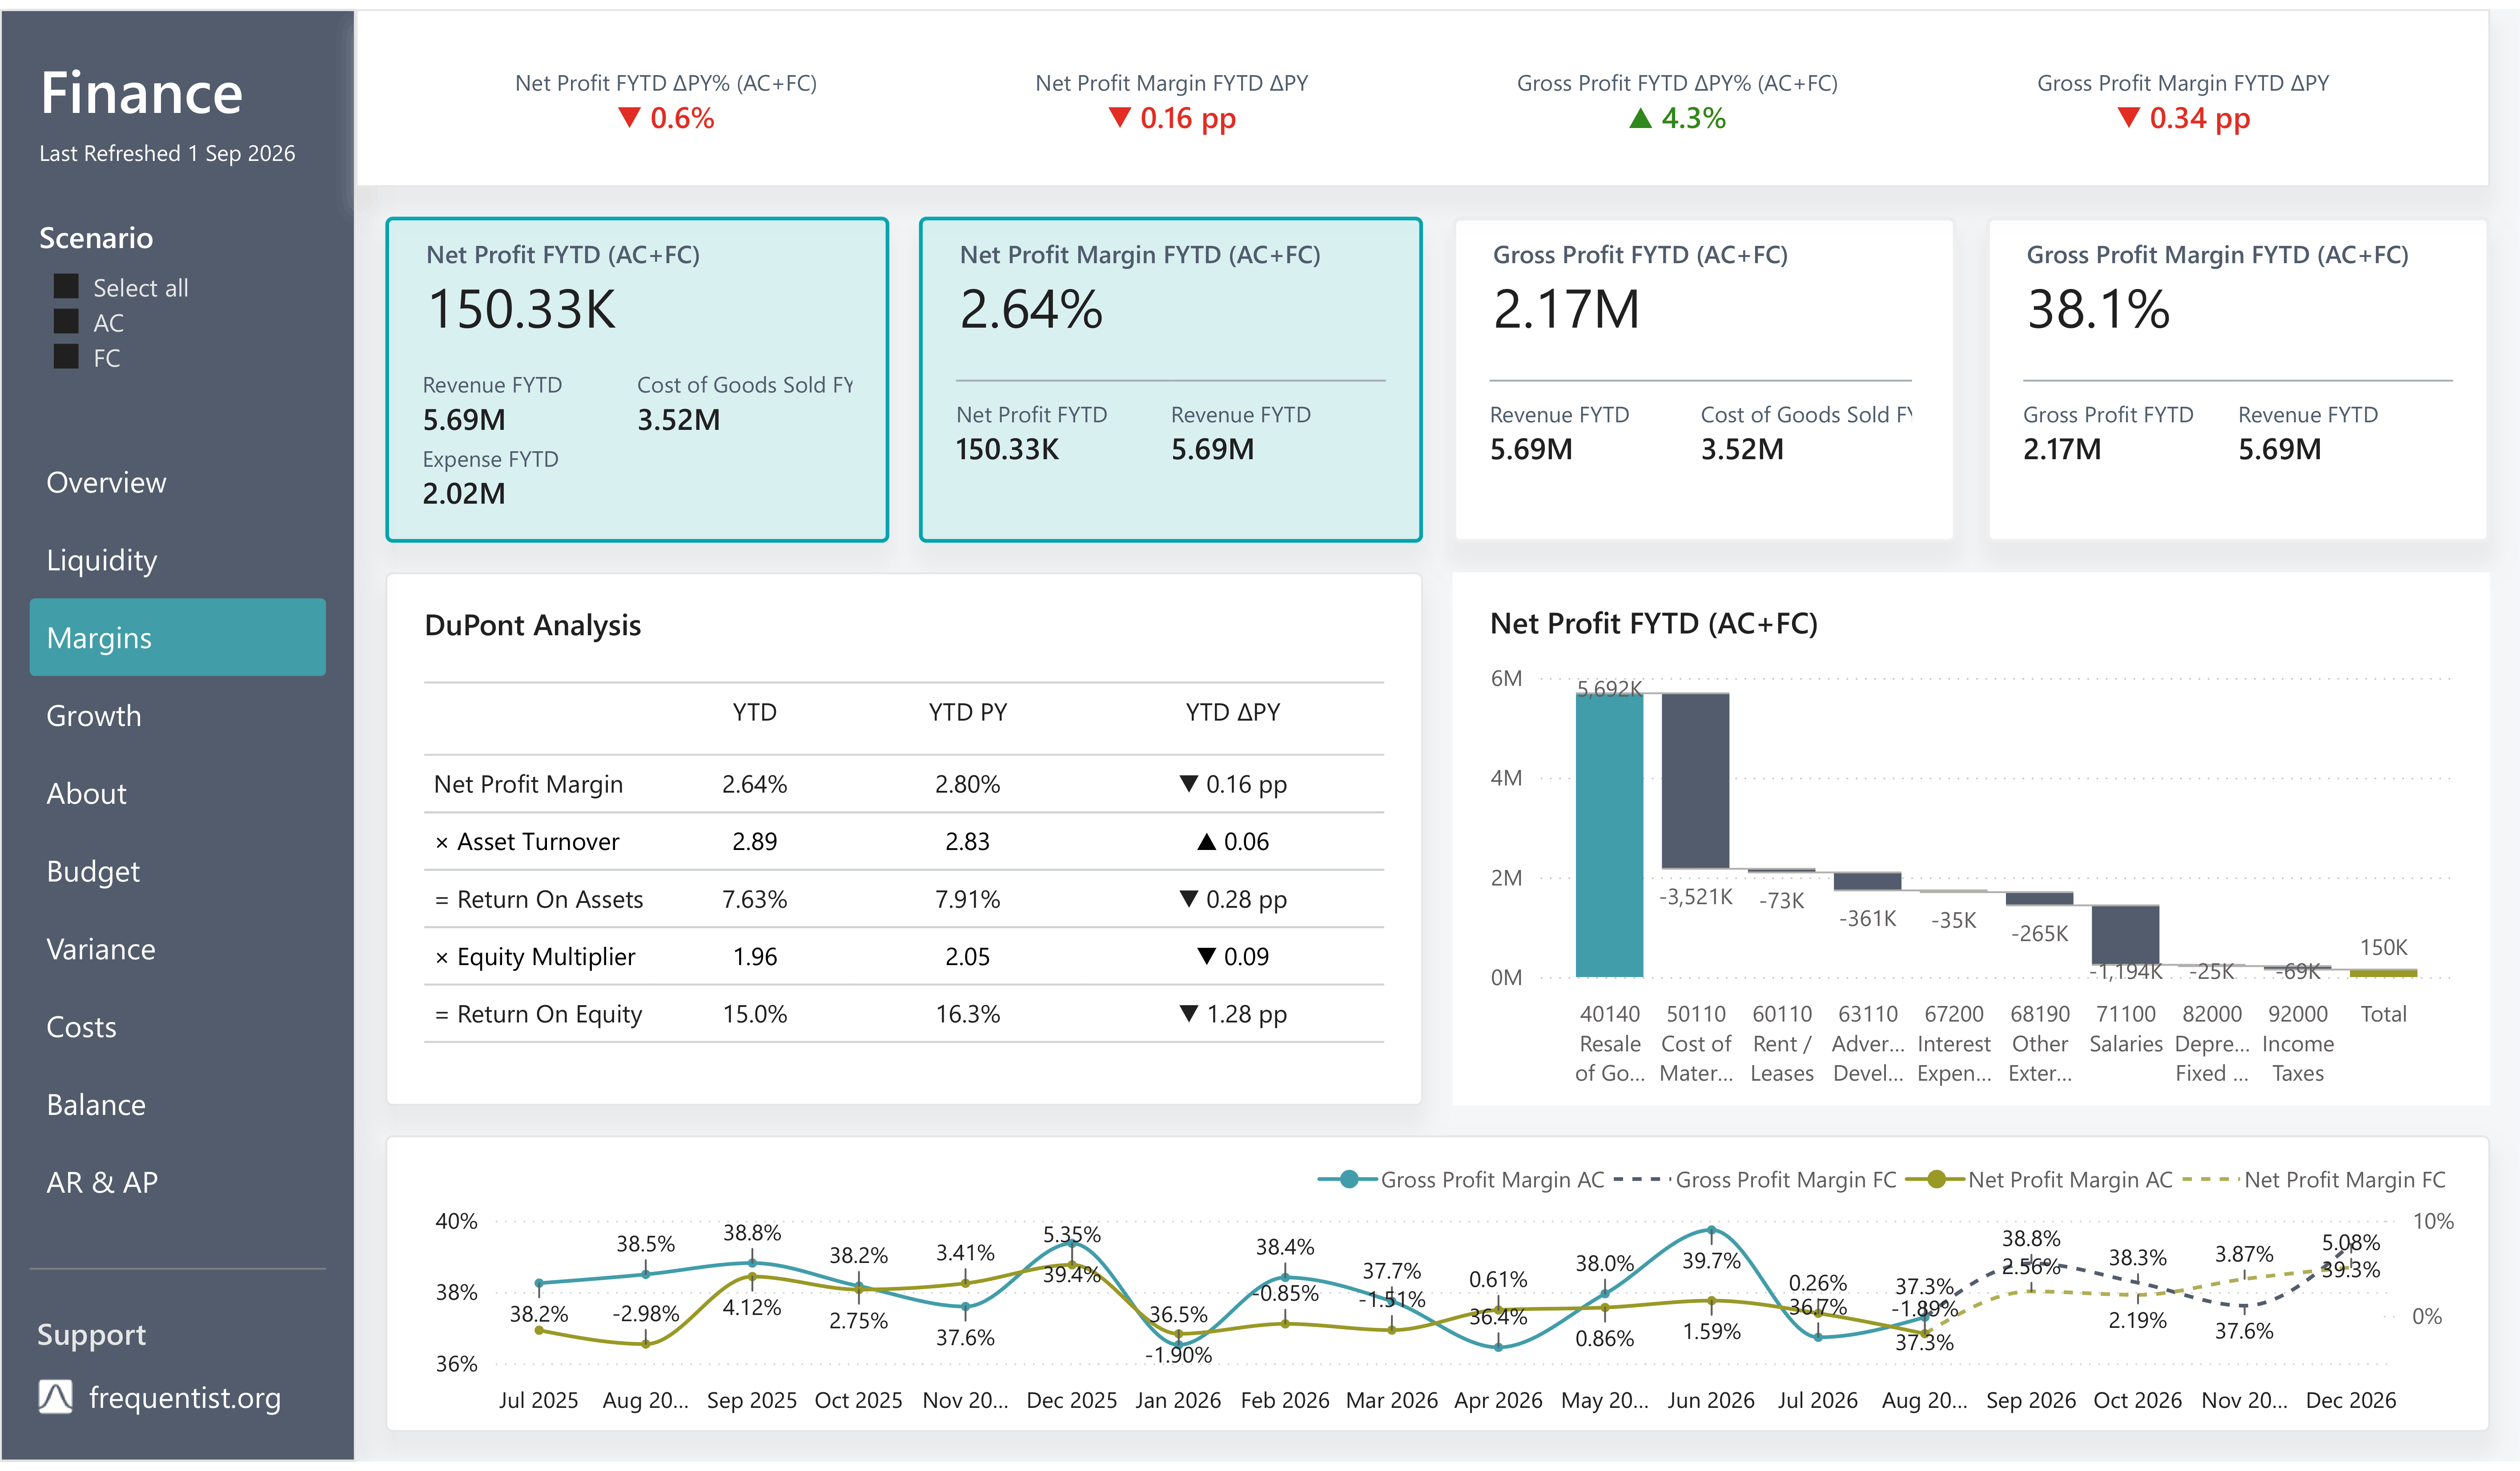
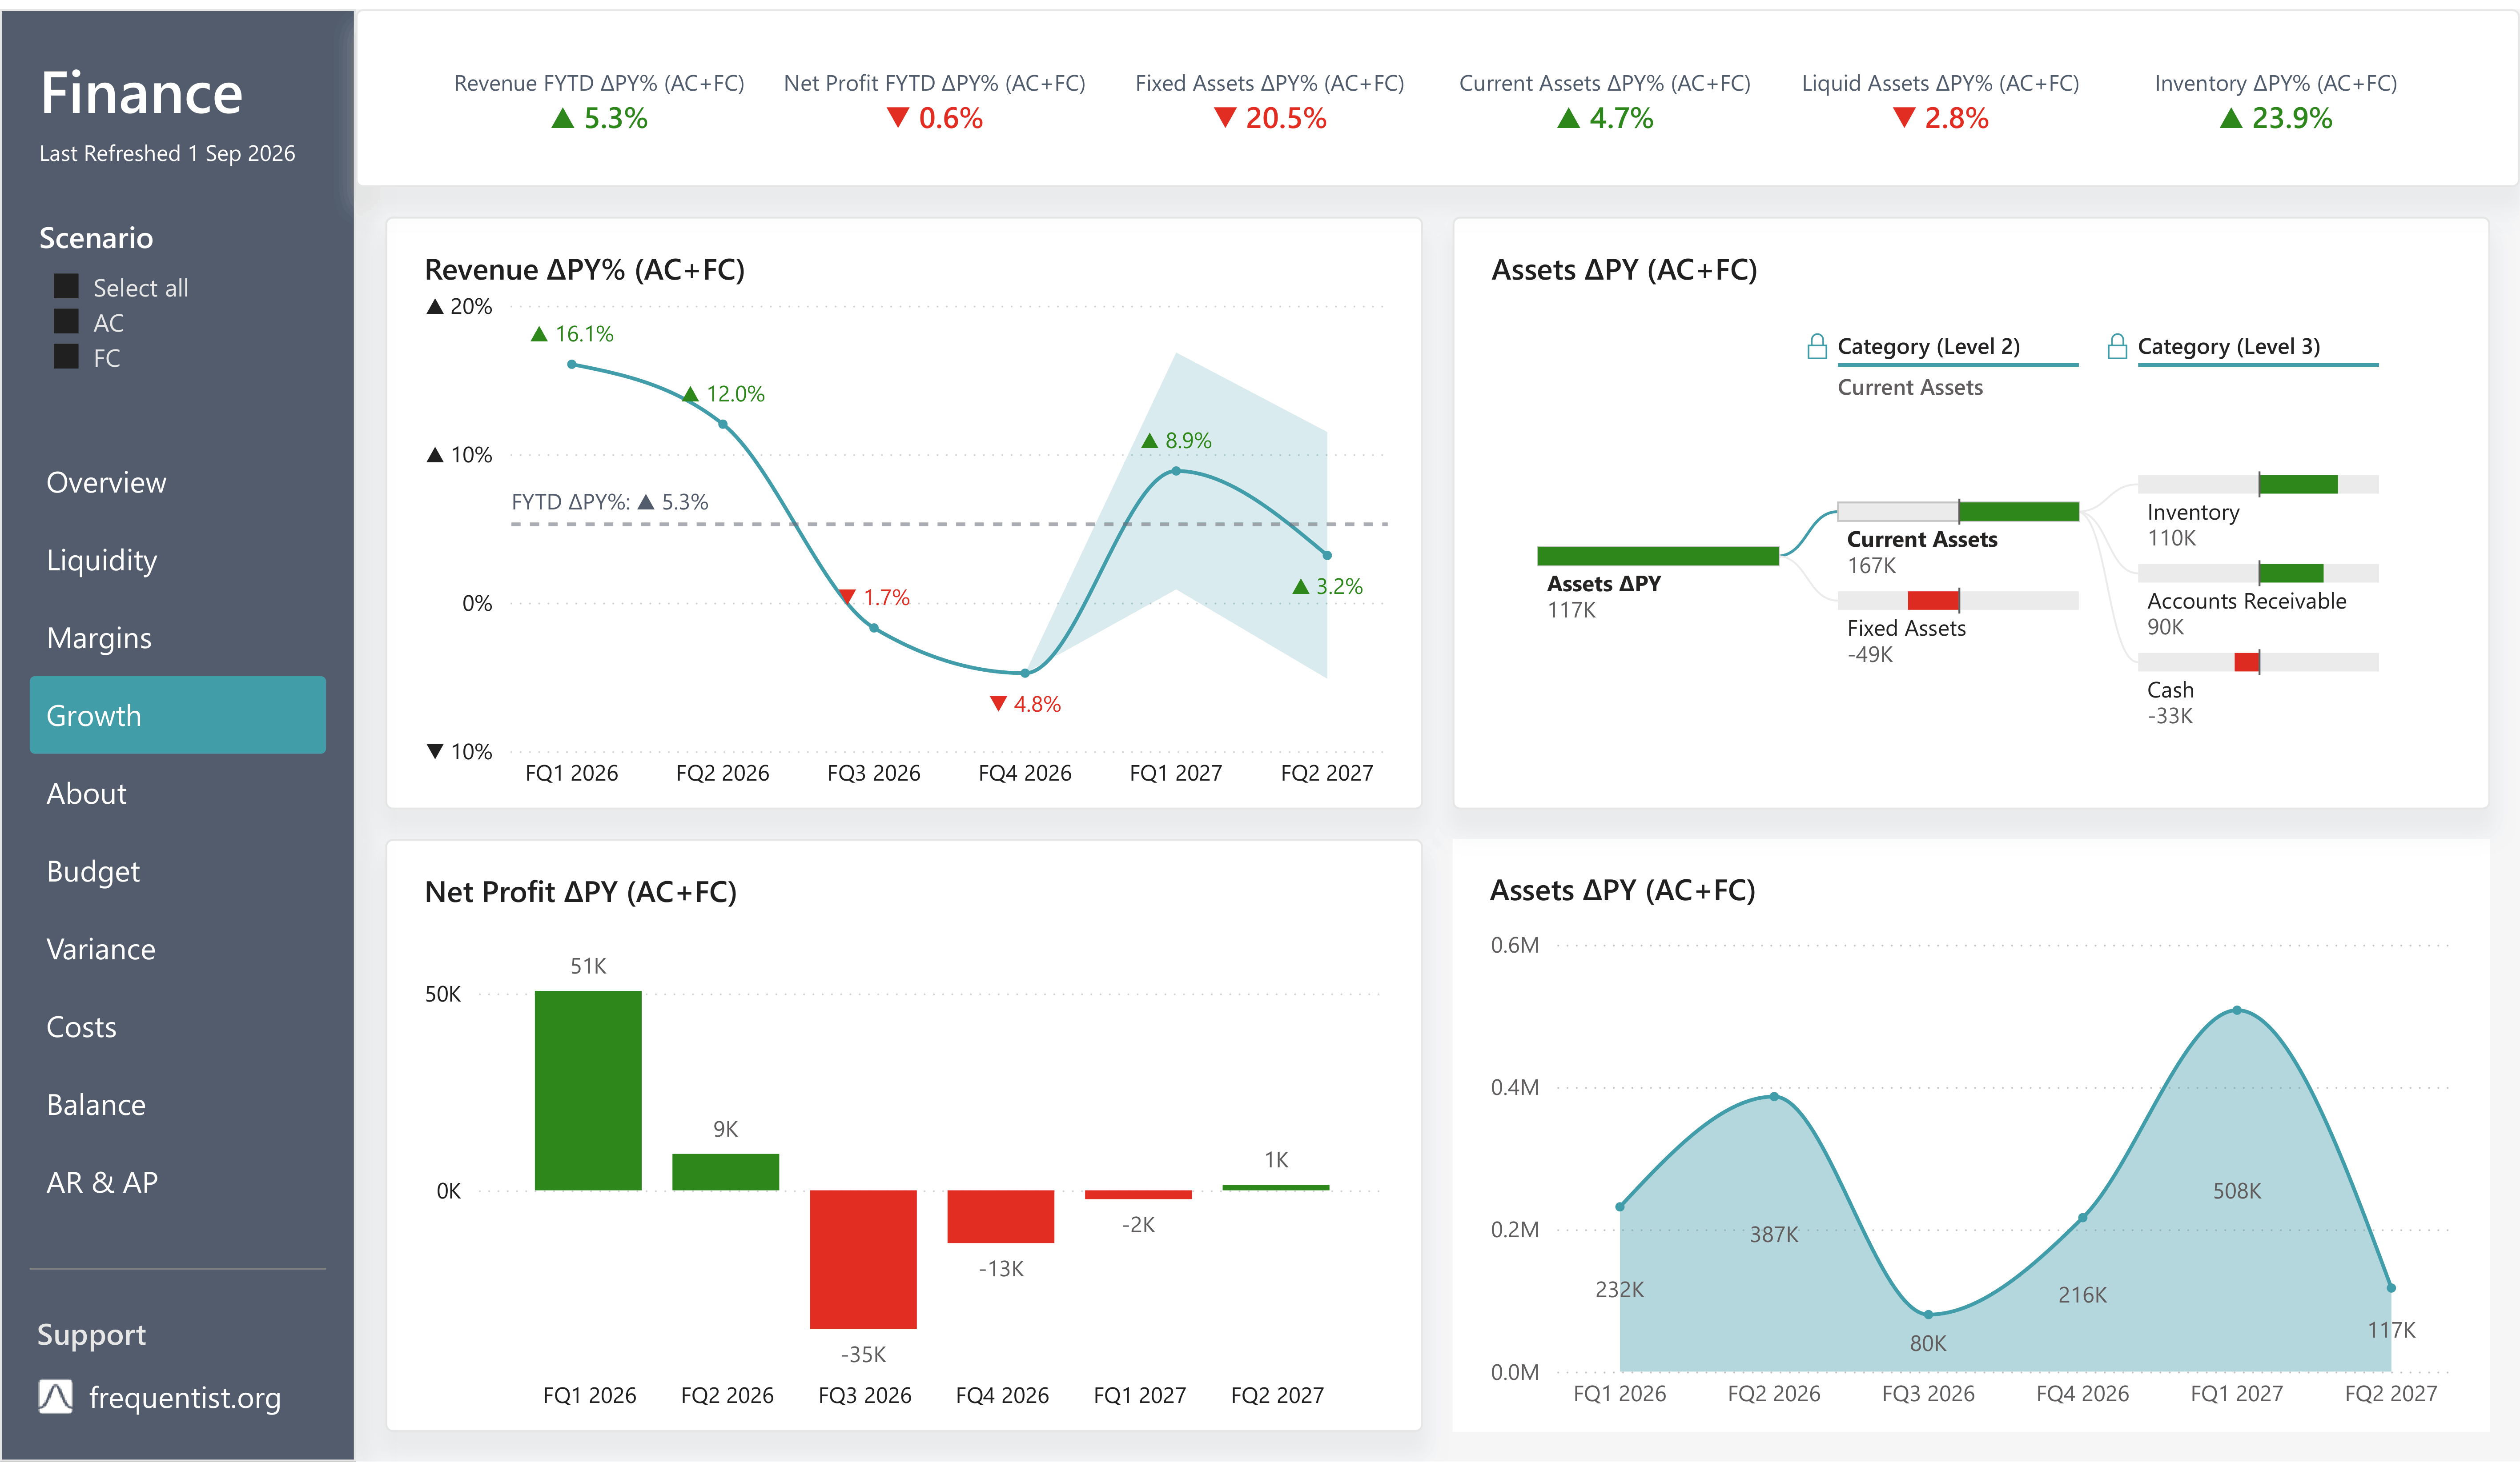
The Business Central tables are never modified. Forecasts go to their own tables with a run timestamp, and SQL views combine the two. Nothing is hard-coded: the forecast starts after the last posting, posting days come from the last 12 months of entries, and cost sensitivities from the actuals. Amounts are split across days so that they still add up to the cent.
About the data. The demo runs on generated data for a wholesale company with 500 customers and 44 months of history, in Business Central’s own chart of accounts and table structures. The pipeline is designed for a live Business Central company to take its place as the source.
R scripts read from and write to the Lakehouse. Each forecast script takes an as-of date. Run over past dates, it rebuilds the forecasts that would have been made then, and those runs supply the error statistics, the ranges and the track record.
The report is maintained as a PBIP project, with rebuilt pages, navigation, visuals and measures for forecasting and financial analysis. A calculation group handles fiscal year-to-date, prior-year comparisons and the actual/forecast split. Titles follow the selected scenario, while changes against last year use directional indicators and percentage-point comparisons where appropriate.
Actuals, budget and forecasts share the same analytical model and reporting measures.
Projected cash shortfalls are identified in advance, with a configurable threshold and a lower-case scenario.
Forecast ranges and historical backtesting help users assess the reliability of projections.
Microsoft Fabric • Business Central data model • SQL views • R forecasting & backtesting • Power BI report redesign • Power BI semantic modeling (DAX, calculation groups, TMDL) • Financial analysis
The other five pages of the report cover budget, variance, costs, the balance sheet, and receivables and payables. To see them, or to talk about what this would look like on your own Business Central data, get in touch via the contact page.