from mpl_toolkits.mplot3d import Axes3D
from matplotlib import cm
from matplotlib.ticker import LinearLocator, FormatStrFormatter
import matplotlib.pyplot as plt
import numpy as np
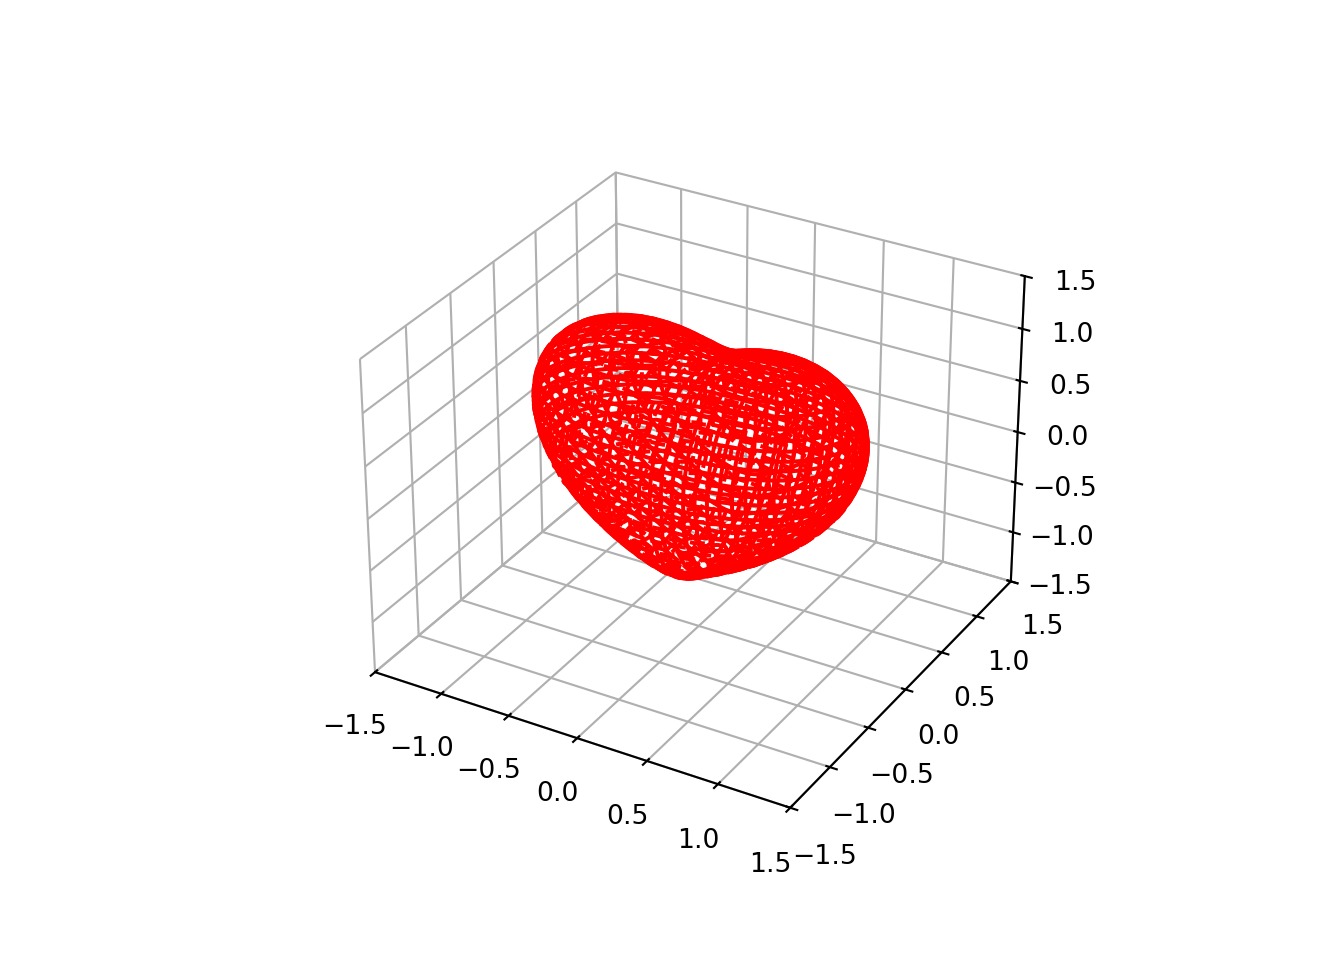
def heart_3d(x, y, z):
return (
(x**2 + (9 / 4) * y**2 + z**2 - 1) ** 3 - x**2 * z**3 - (9 / 80) * y**2 * z**3
)
bbox = (-1.5, 1.5)
xmin, xmax, ymin, ymax, zmin, zmax = bbox * 3
fig = plt.figure()
ax = fig.add_subplot(111, projection="3d")
A = np.linspace(xmin, xmax, 100) # resolution of the contour
B = np.linspace(xmin, xmax, 40) # number of slices
A1, A2 = np.meshgrid(A, A) # grid on which the contour is plotted
for z in B: # plot contours in the XY plane
X, Y = A1, A2
Z = heart_3d(X, Y, z)
cset = ax.contour(X, Y, Z + z, [z], zdir="z", colors=("r",))
for y in B: # plot contours in the XZ plane
X, Z = A1, A2
Y = heart_3d(X, y, Z)
cset = ax.contour(X, Y + y, Z, [y], zdir="y", colors=("r",))
for x in B: # plot contours in the YZ plane
Y, Z = A1, A2
X = heart_3d(x, Y, Z)
cset = ax.contour(X + x, Y, Z, [x], zdir="x", colors=("r",))
_ = ax.set_zlim3d(zmin, zmax);
_ = ax.set_xlim3d(xmin, xmax);
_ = ax.set_ylim3d(ymin, ymax);
ax.xaxis.set_pane_color((1.0, 1.0, 1.0, 0.0))
ax.yaxis.set_pane_color((1.0, 1.0, 1.0, 0.0))
ax.zaxis.set_pane_color((1.0, 1.0, 1.0, 0.0))
plt.show()